

Project: Integrating HPX with the Tracy Profiler
Contributor:Vansh Dobhal
Organization: The STE||AR Group
Mentor: Hartmut Kaiser, Panagiotis Syskakis
How I added first-class Tracy profiler support to HPX during GSoC 2026 — fiber-based task visibility, a unified tracing interface, suspension reasons, and causal tracing across 23 merged pull requests.
HPX is a C++ runtime that runs many lightweight tasks on a smaller number of worker threads. If you have 10 worker threads and 50,000 tasks, the runtime keeps moving tasks on and off those threads as they suspend and resume.
Tracy is a profiler. Before this project, if you attached Tracy to an HPX program, this is what you saw:
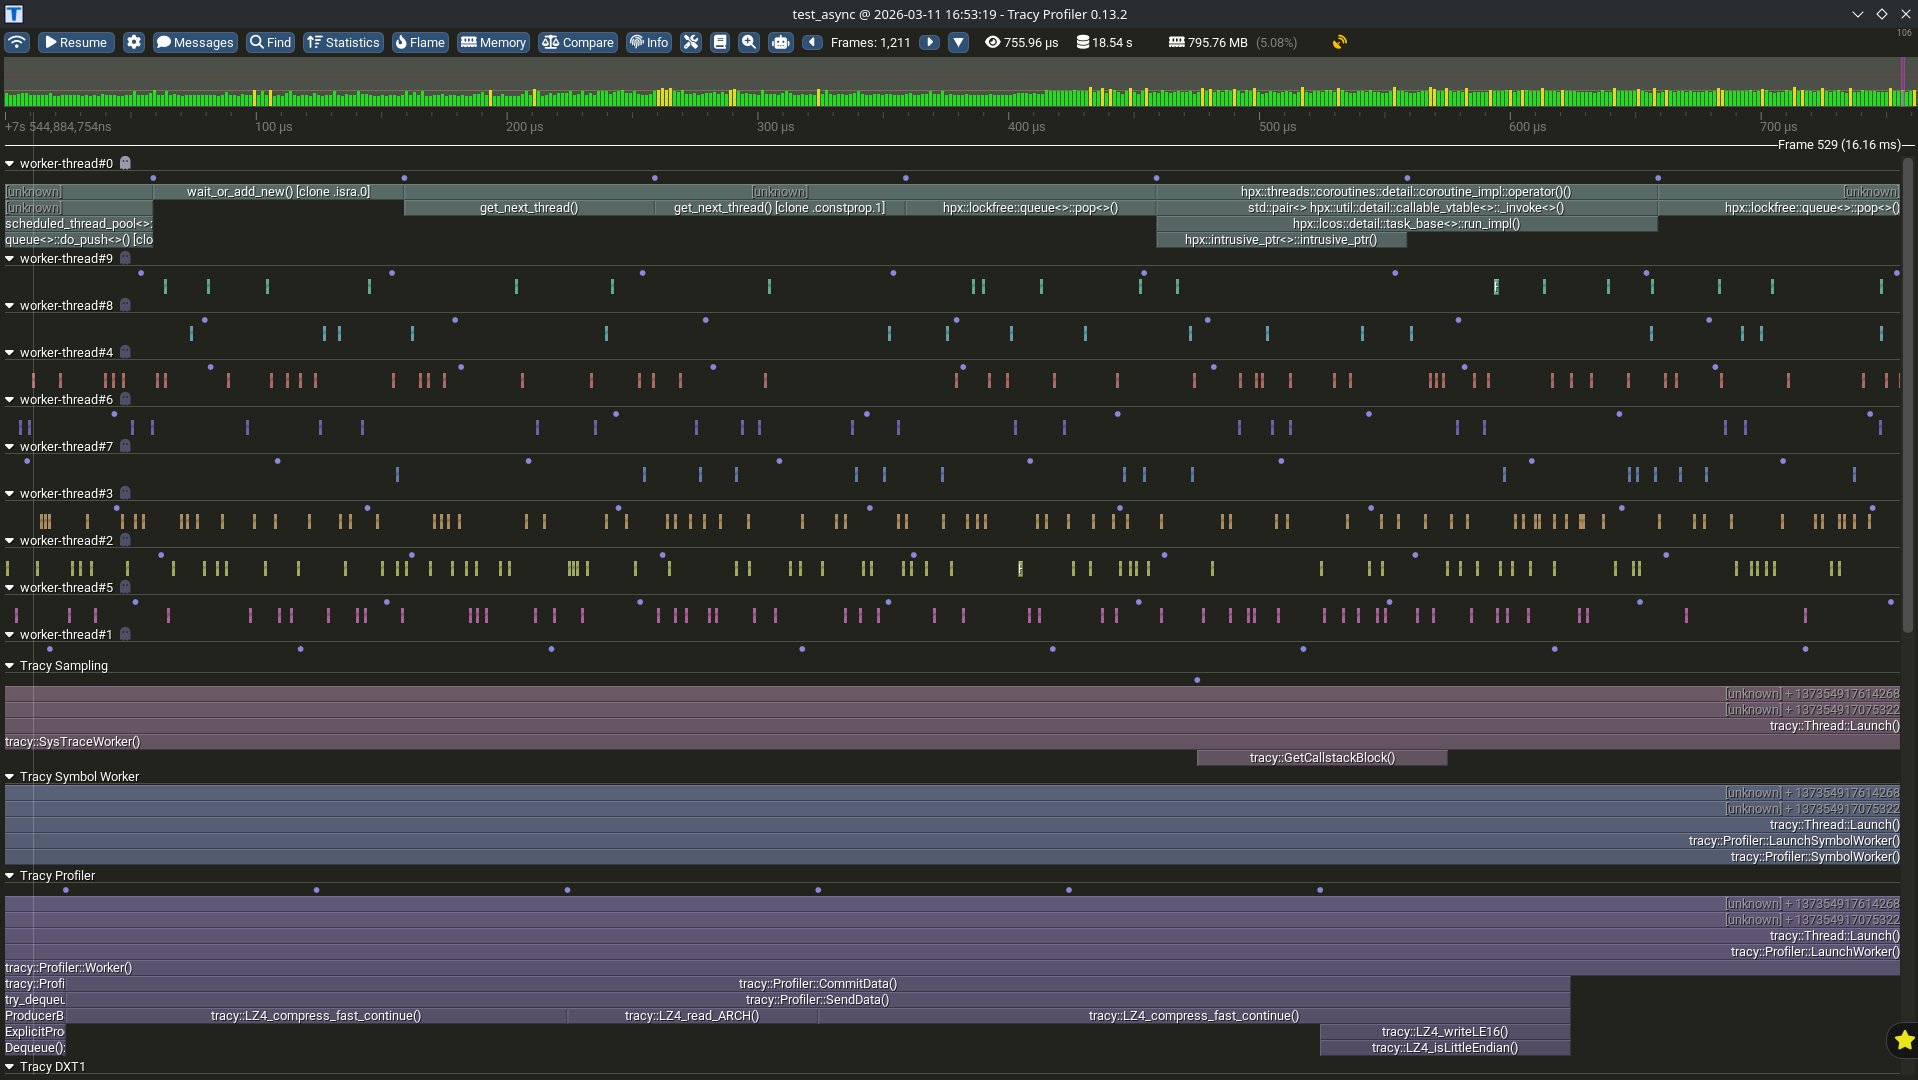
Those rows are the OS worker threads. Task executions do show up, as those narrow ticks, but only as isolated slices on whichever thread ran them. If a task ran for 3 milliseconds, suspended, and resumed on a different worker 40 milliseconds later, nothing in this view connects those two slices.
My project was to fix that.
Mapping tasks to fibers
Tracy has a feature called fibers. It was built for coroutines, where a piece of work can pause and continue on a different thread. That is exactly what an HPX task does.
The Tracy module in HPX already had fiber wrappers, enter_fiber(), leave_fiber(), and fiber_region. Nothing called them. I opened issue #6989 to ask whether mapping tasks to fibers was the intended direction, and started experimenting.
The first attempt worked and immediately broke something else. Tasks showed up as fiber rows, but the worker thread rows disappeared. Hartmut pointed out that this was a problem: without the worker rows you cannot see utilisation at all, which is often the thing you actually want to know.
The fix turned out to be about ordering. In the scheduling loop I open the worker thread zone first, before any fiber is active, so Tracy attributes it to the OS thread row. Then I enter the fiber and open a second zone on the fiber stack. Because the worker zone is declared first, C++ destroys it last, so the fiber leaves before the worker zone closes and both stacks unwind cleanly.
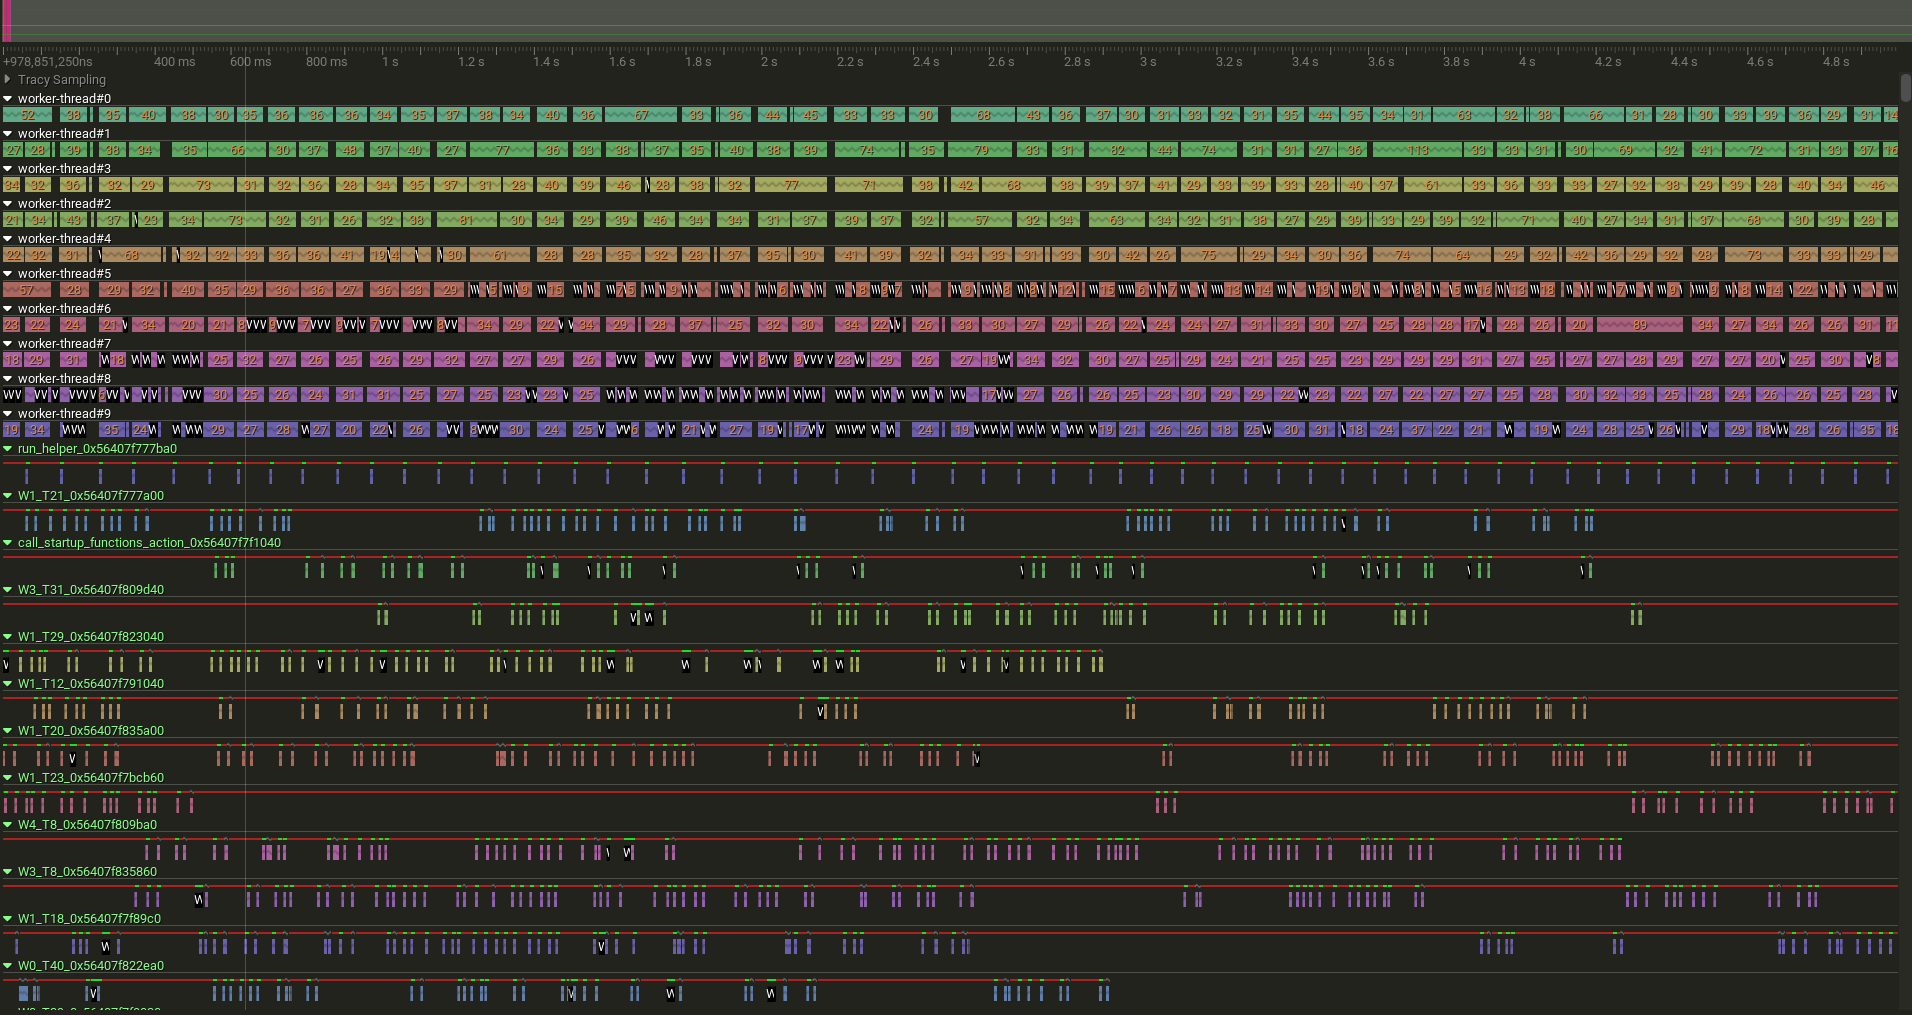
The fiber names combine the task’s description with its address, so each task gets a stable identity. The names in that trace, like W1_T21_0x56407f777a00, come from my test workload, where W1_T21 is the description I gave the task and the rest is where it lives in memory. Stability matters more than it sounds: Tracy links execution slices by fiber name, so if the name changed between suspensions, one task would appear as several unrelated ones.
Two things I learned the hard way here. TracyFiberEnter on its own draws nothing. It only switches which zone stack is active, so you have to explicitly open a zone afterwards or the row stays empty. And after entering a fiber, any attempt to rename the worker thread zone aborts with “zone name transfer destination doesn’t match active zone”, because the stored zone context belongs to the OS thread stack while Tracy has already switched to the fiber.
This work merged as #7017.
Following a task across workers
Once fiber identity is stable, task migration becomes something you can just look at.
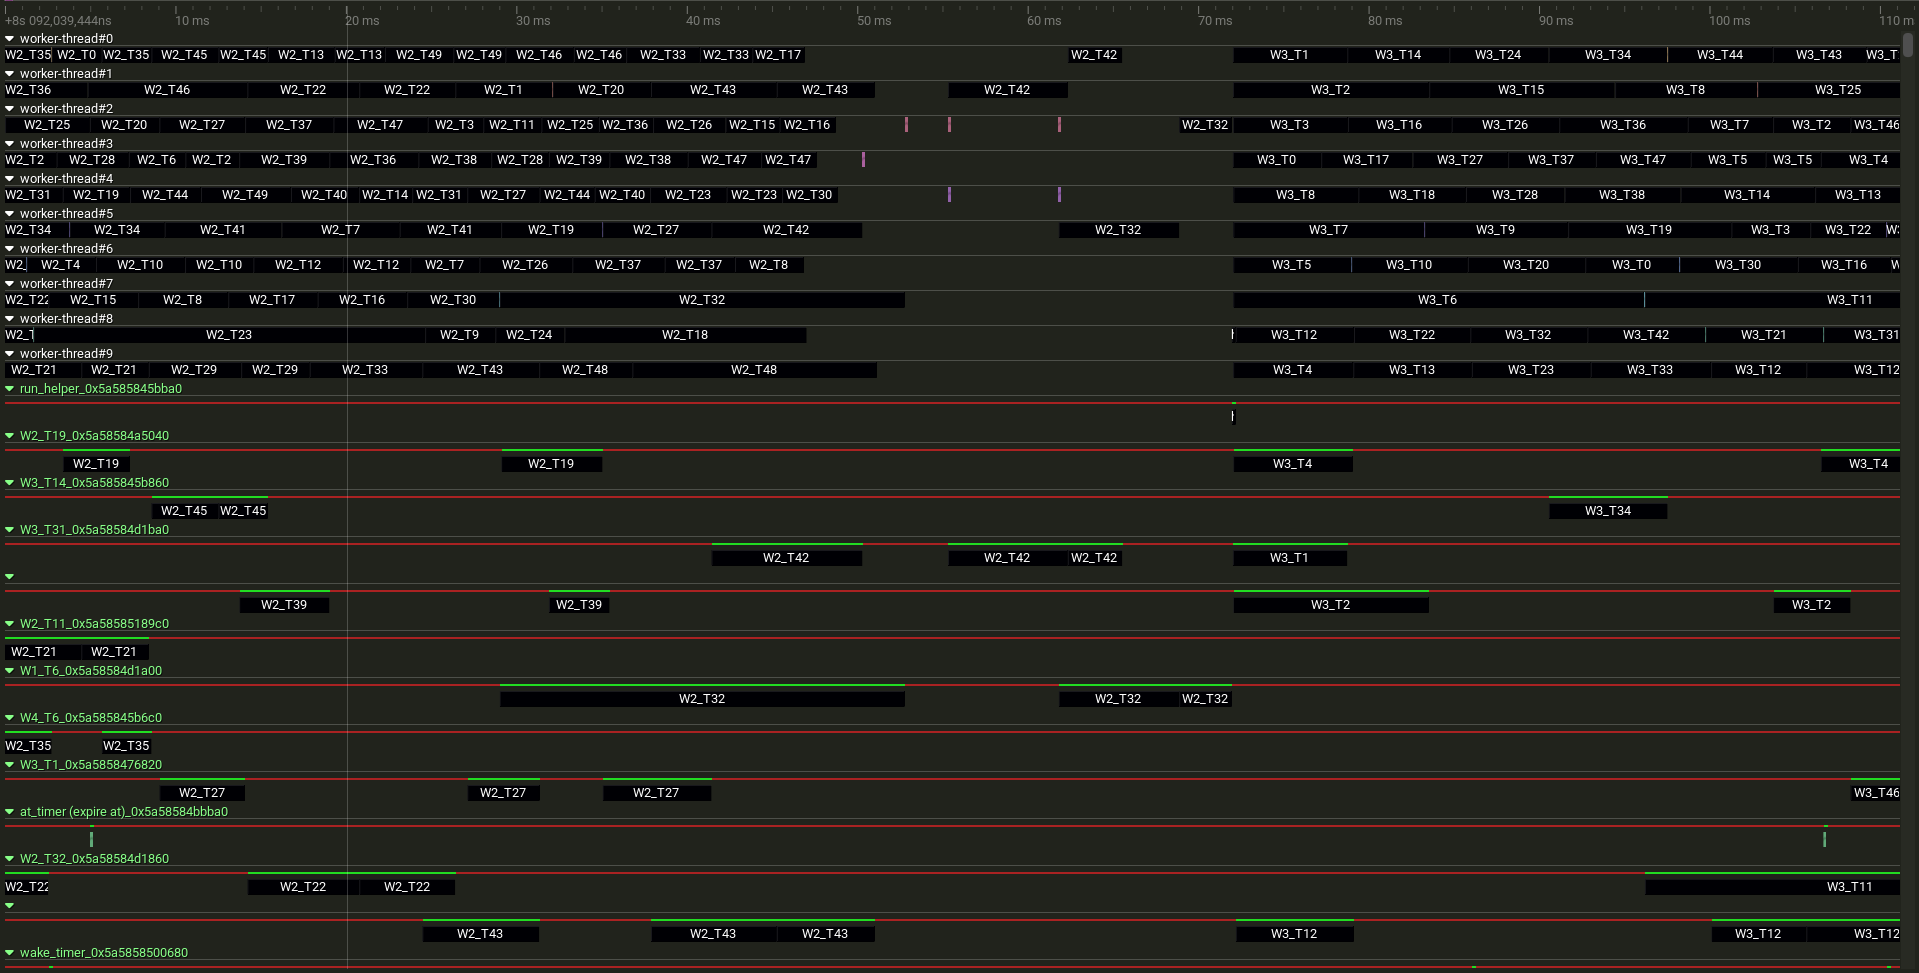
Pick a fiber row and follow it left to right. Its first slice lines up with one worker thread, then there is a gap where the task is suspended, then it resumes on a different worker. That gap and that switch are the things that were completely invisible before.
One interface instead of three
While working on the fibers, a second problem became obvious. HPX supported three profilers: Tracy, Intel’s ITTNotify, and APEX. Each had its own #ifdef blocks scattered through the scheduler, the executors, the algorithms, the synchronisation primitives, and the runtime startup code. They shared nothing. Adding a fourth backend, or removing one, meant touching dozens of files.
Panos raised the idea of a common interface, and I opened issue #7049 to propose it. The result is hpx::tracing: one header, backend-agnostic calls, compile-time dispatch to whichever profiler is enabled, and constexpr no-ops when none is.
This turned into the largest part of the project by volume. Twelve pull requests moved Tracy, ITT, and APEX behind the same interface, covering the scheduler, executors, mutexes, spinlocks, futures, parcels, actions, performance counters, and runtime initialisation. One of them touched 66 files, another 35. Most of the work was deleting conditional compilation rather than adding anything.
Two decisions shaped it. Only one backend can be active at a time, enforced in CMake rather than left to chance, because having two profilers instrumenting the same runtime was never a supported feature so much as an accident nobody had ruled out. And the tracing members embedded in synchronisation primitives are marked so the compiler can collapse them to nothing, which means a build without tracing carries no extra bytes per mutex or spinlock (#7264).
There is also the problem of how you know a backend still works. Compiling is not the same as functioning, and the Intel one is easy to break silently since almost nobody builds with it. So it got its own CI job (#7258): the workflow pulls Intel’s ittapi, builds their reference collector, runs a test with the collector loaded, and greps the log for __itt_domain_create and __itt_task_begin. If those calls do not appear, the build fails. It verifies the instrumentation actually reaches the profiler rather than just compiling into the binary.
One more constraint worth mentioning: the macros had to move into their own header, because macros do not cross C++20 module boundaries and HPX is being adapted for modules.
The most interesting problem was a dependency cycle. hpx::tracing needed task information, so it wanted to depend on threading_base. But threading_base already depended on the Tracy module. The fix was to introduce plain data structs, region_init_data and fiber_region_init_data, holding only primitive types. threading_base extracts what tracing needs and hands it over, so the dependency arrow points one way.
The same constraint bit again later. Because the tracing module sits at the bottom of the dependency stack, it cannot use hpx::mutex, which lives higher up. In HPX, using std::mutex inside runtime code is normally a mistake, since it can block the thread driving the scheduler. The one place that genuinely needed a lock, a counter tracking how many continuations are running, ended up with a plain std::mutex around the counter updates. Adding connection gating in #7497 surfaced a real bug there: with both sides gated, a continuation that starts while no profiler is connected skips the increment, then when one connects before it finishes, the decrement fires unmatched. The fix was to make the counter unconditional and gate only the Tracy plot call — which also made the mutex unnecessary. It is now std::atomic<std::int64_t>, updated on every continuation regardless of connection state.
What state is a task in
Fiber rows show when a task runs. They do not show what happened to it in between.
An HPX task moves through a set of states: staged, created, executing, yielded, suspended, resumed, completed, deleted. The runtime tracks all of this internally. None of it was visible.
I added a hook for each transition, emitted as a colour-coded message on the task’s own fiber row (#7347), then wired those hooks into the places where the transitions actually happen: task creation, the scheduling loop, the background thread runner, and the direct execution path (#7357).
Two things made this harder than adding nine function calls.
HPX recycles thread_data objects rather than allocating a new one per task. So the same object can be a different task later, and if you only emit on construction and destruction, two unrelated tasks share one identity in the trace. The rebind path now emits a deletion for the old task and a creation for the new one, so recycled objects show up as separate lifetimes.
The other was an event I designed and then deleted, which is in the list further down.
I also drew the state machine as a diagram and committed it into thread_enums.hpp, next to the state enum itself, so the next person to touch this has the transitions written down where they will actually look.
Why a task stopped
A suspended task shows up as a gap on its fiber row. A gap tells you nothing about why.
HPX already had suspension markers for LIKWID, another profiling tool, at the points where tasks yield or block. Those markers turned out to be a good map. I added Tracy suspension zones at the same places, then extended past the first one into this_thread::suspend and the timed suspension path, which Hartmut pointed me at.
Searching a trace for suspension zones went from finding nothing at all to this:
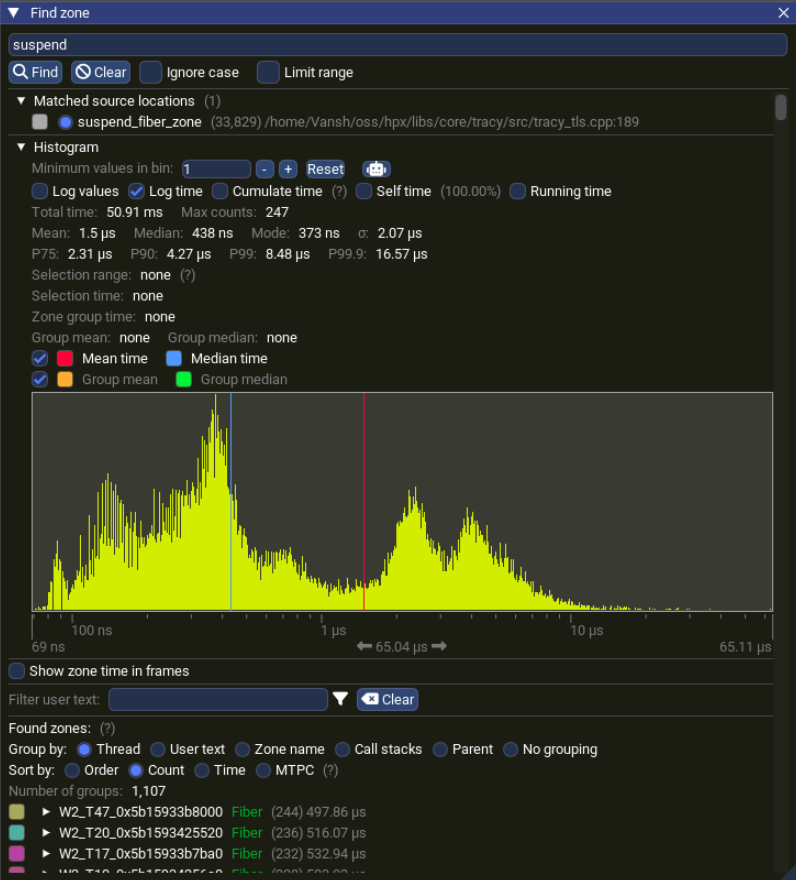
The zones also carry a reason. Instead of every suspension looking identical, the label propagates whatever description the caller supplied, so a task waiting on a future shows future_data_base::wait rather than a generic “suspended”.
This merged across #7145 and #7372.
Why a task resumed
Knowing a task stopped is half the picture. The harder question is what woke it up.
When a task waits on a future, something else eventually fulfils that future, and the waiting task becomes runnable again. Nothing in the trace connected those two events. Hartmut also asked about tracking dependencies through messages between localities, which is the distributed version of the same problem.
I instrumented the producer side, set_value and set_exception in future_data, and the consumer side, packaged_continuation::run_impl. Both carry the address of the shared state they are operating on.
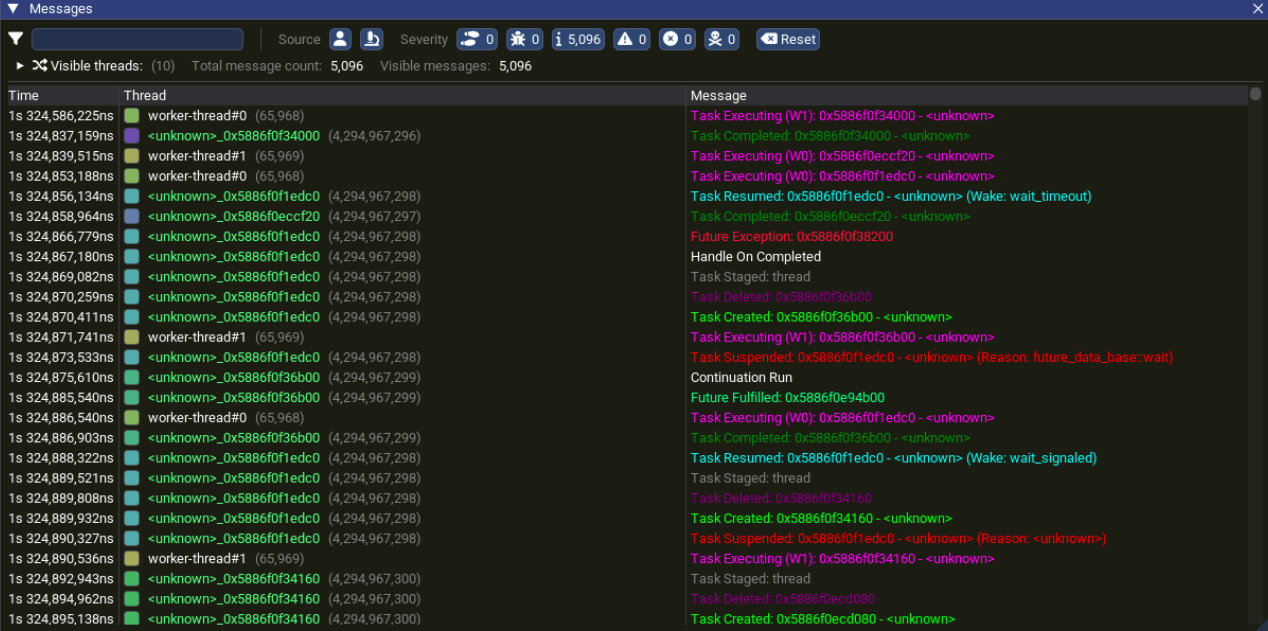
Read that panel top to bottom and you get the story. A task suspends with reason future_data_base::wait. A future is fulfilled, in green. Handle On Completed Fired appears. Continuation Run appears. The waiting task resumes with Wake: wait_signaled. The addresses match on both sides, so you can search a trace for one address and find every event connected to that specific future.
Tracy has no way to draw arrows between fiber zones, so the link is text embedded in the zone rather than a line on screen. It is less pretty than an arrow and just as usable, because Tracy’s search works on that text.
There is also a live plot of how many continuations are running at once. It started out as a cumulative total, which turned out to be useless for spotting pressure since a number that only goes up tells you nothing about now. Adding a matching finish hook, fired through a scope guard, turned it into a real gauge that rises and falls with load. Hartmut noted it should eventually become a proper HPX performance counter rather than a Tracy-only plot.
This is #7423, along with two smoke benchmarks that exercise the value and exception paths end to end.
Two blind spots
Not all work goes through the scheduler.
fork_join_executor runs bulk data-parallel work directly on worker threads, bypassing the task scheduler entirely. Anything using it, hpx::for_each for example, showed up as workers doing nothing. I added markers at the executor’s dispatch points (#7392).
Inline continuations were the other one. When a future is fulfilled, an attached .then() often runs immediately on the fulfilling thread instead of being scheduled separately. That work was blending invisibly into whatever task happened to be running. Three lines fixed it (#7403), and it turned out to be a prerequisite for the causal tracing above.
Where work goes when a worker runs out
Everything above is about tasks that are running. The other half of a scheduler’s behaviour is what happens when a worker has nothing to do.
Three things can happen. It steals work from another worker, it polls background subsystems, or it goes to sleep. None of the three was visible.
Steal events now appear as messages naming the thief, the victim, and the task that moved (#7450). Background polling is wrapped in its own timeline zone showing which worker is polling, with whatever the subsystems actually do appearing as child zones inside it (#7484). A worker heading for sleep emits a marker.
Two honest limits. Steal events come from two of the six schedulers, so somebody running one of the others still sees nothing. And the sleep marker is a point, not a span: it tells you a worker was about to sleep, not how long it slept or what woke it. Both are on the list below.
The background zone is also narrower than it looks. It wraps the call that kicks off background work, not the work itself, so it measures the scheduler’s cost of starting a poll rather than the duration of any network operation. That distinction matters because those operations are asynchronous and can finish on a different thread entirely, which is exactly why they do not belong inside a region on one thread’s timeline.
What it costs
My proposal said tracing overhead should stay under 5%. Late in the project I finally measured it properly, and the answer is more complicated than a single number.
I compared three builds on a task creation benchmark: no tracing compiled in, Tracy compiled in with no profiler attached, and Tracy with a profiler attached.
The cost of tracing with no profiler attached comes from about 13 separate Tracy API calls per task lifecycle. Each one formats a message with snprintf, crosses into the Tracy client, and the client checks whether a profiler is connected before throwing the work away. On four workers that added roughly 104 nanoseconds per task; on one worker, 283 nanoseconds.
Whether that is acceptable depends entirely on your tasks. The benchmark creates empty tasks that cost about 100 ns each on four workers, so the instrumentation nearly doubled the runtime in the worst case. Most real HPX tasks do considerably more work than that.
#7497 moved the connection check to the HPX call site as an inline atomic load, so the formatting and Tracy API call never happen when nothing is listening. The before and after, measured on the same benchmark:
| Workers | Before | After |
|---|---|---|
| 1 | +283 ns/task | +76 ns/task |
| 4 | +104 ns/task | +43 ns/task |
| 8 | +25 ns/task | within noise |
What remains is per-subsystem compile-time gates, so a build that only needs task visibility does not pay for causal tracing, and per-task sampling, carrying the decision on the task object itself so it survives being stolen by another worker.
With a profiler attached, fine-grained task workloads are much slower, which is expected for any profiler recording millions of events per second. For data-parallel workloads the overhead stayed in the 0 to 5% range, because the markers there are spread across large chunks of work.
Trace size matters too. Hartmut warned early on that this could get out of hand with many tasks, and he was right to. A profiled run produces about 65 MB per million tasks compressed. That is fine for a short profiling session and impractical for a long one, which is exactly what filtering and sampling are for.
Measured on an Intel Core i5-13450HX, 10 cores and 16 threads, CPU governor set to performance, sustained around 4.4 GHz, GCC 16.1 at -O3 -DNDEBUG, 25 reps at 1 and 4 workers and 12 at 8, on an otherwise idle machine. The multi-worker numbers move around more, partly because this is a hybrid CPU and a worker landing on an efficiency core rather than a performance core changes the baseline more than it changes the instrumentation.
Things that did not work
std::optional in the scheduling loop. My first version wrapped the tracing objects in std::optional so they could be conditionally constructed. Hartmut asked whether there was a way to avoid conditional construction in the hottest loop in the runtime. Replaced with always-declared objects carrying an internal enabled flag, so the loop keeps the same shape whether tracing is on or off.
A pimpl for the ITT backend. That version did a heap allocation per task execution. Caught in review before it landed. Backend types are stored inline now.
rename_region. I added it as an abstraction, and it turned out to be the wrong shape. My mark_event used it to rename whatever zone was currently open and then rename it back on destruction. That works on a worker thread row. It aborts inside a fiber, because Tracy’s zone stack has already switched while the context I stored still points at the OS thread’s zone. The abort message is Tracy telling you the rename destination does not match the active zone, which is accurate and took me a while to read correctly. The fix was to change what mark_event means: instead of renaming somebody else’s zone, it now opens its own child zone and closes it. That is a better design regardless of the crash, and it landed just before I instrumented the fork-join executor with it.
Turning off call stacks. Steal events fire in a tight loop, and every Tracy message captures a ten-frame call stack, so I set the depth to zero on the grounds that the message text already carried the thief, the victim and the task pointer. Hartmut asked whether removing all stack backtraces was intentional. It was, but only for the case I had in front of me, and the same change would have stripped call stacks from every other message in the runtime. Reverted before merge.
A task_scheduled event. I designed it, implemented it across all four backends, then removed it. While wiring it up, Hartmut pointed out that putting a thread in a queue and marking it pending are conceptually the same operation. Once I went looking properly, the event was not being called anywhere in the runtime, so it went.
Eight bytes per task. Adding a member to thread_data in the wrong position silently grew the struct by 8 bytes. Hartmut posted memory layout diagrams showing it. Moving the member into existing padding removed the growth entirely. Multiply 8 bytes by millions of tasks and it stops being trivial.
Where things ended up
| Milestone | Status |
|---|---|
| Fiber-based task tracing | Done |
Unified tracing interface (hpx::tracing) |
Done |
| Task lifecycle instrumentation | Done |
| Suspension reasons | Done |
| Executor and continuation coverage | Done |
| Causal tracing | Done |
| ITTNotify regression CI | Done |
| Trace optimization (filtering, sampling) | Partial — connection gating done (#7497); filtering and sampling not started |
| Work-stealing visualisation | Done |
| Background work and sleep instrumentation | Done |
| Distributed trace correlation | Not done |
23 pull requests merged, 2 issues opened and closed, roughly 6,100 lines added and 2,100 removed.
What comes next
Trace optimization. Per-subsystem compile-time gates would let a build that needs only task visibility skip the cost of causal tracing entirely. Per-task sampling is the other gap: the decision should be made once when a task is created and carried on the task itself, so it survives being stolen by another worker and does not require resampling at each instrumentation point.
The rest of the schedulers. Steal events currently come from two of the six. local_queue_scheduler and shared_priority_queue_scheduler both steal and neither is instrumented. The steal event should also carry the victim’s queue depth, which is what turns a list of steal events into an answer about load balance.
Sleep duration. A worker heading for sleep emits a marker, and that is all. There is no span, so no duration, and nothing is emitted when it wakes. The marker also fires when the queues come up empty rather than at the moment the thread blocks on the condition variable, which is several branches later and not always reached. Fixing all three would let you tell an idle worker from a starved one.
Distributed tracing. Parcel ids already survive serialization, so the key needed to match a send on one locality to a receive on another already exists. Nothing emits it yet. Tracy 0.14 shipped a capture daemon and a trace merge tool while this project was running, which is what makes looking at several localities together practical for the first time.
Task-level visibility in VTune. ITT tasks are tied to the thread that starts them, which is why I assumed a migrating HPX task could not be drawn there at all. It turns out ITT has a separate API for overlapped tasks, meant for work that spans threads. If it renders the way I think it does, VTune could show HPX tasks the way Tracy does now.
I plan to keep working on all of these.
Thanks
Thank you to Hartmut Kaiser for reviewing every single one of these pull requests, often within hours, and for catching problems I would not have found on my own. The std::optional overhead, the struct layout, the redundant lifecycle event, the std::mutex question: all of those came out of review, and the code is better for it.
Thank you to Panagiotis Syskakis for the weekly discussions and for the idea of unifying the backends, which turned into the largest piece of this project.
And thank you to the STE||AR Group and Google for the opportunity. I came into this wanting to understand how runtimes actually schedule work. I have spent five months reading the HPX scheduler closely enough to instrument it, which is a good way to learn.
